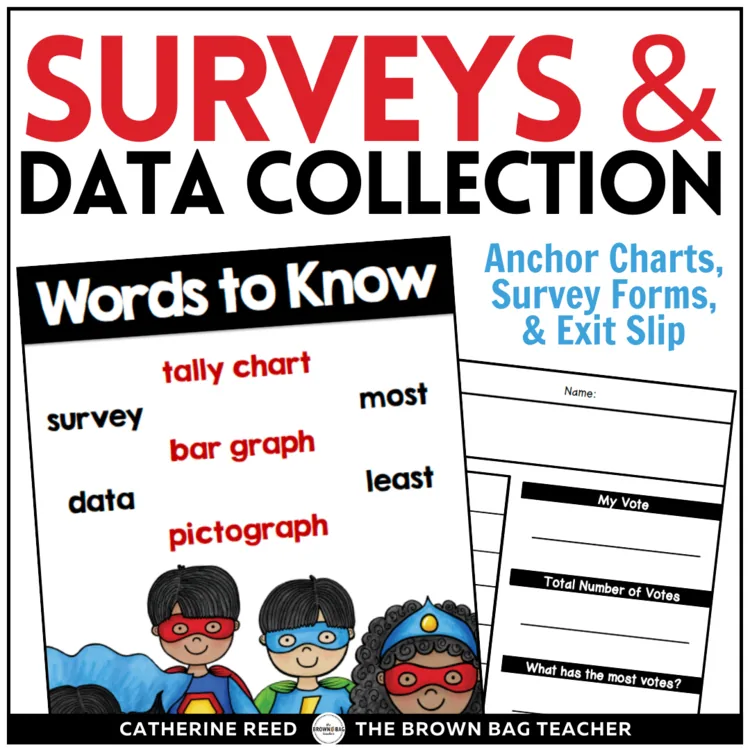
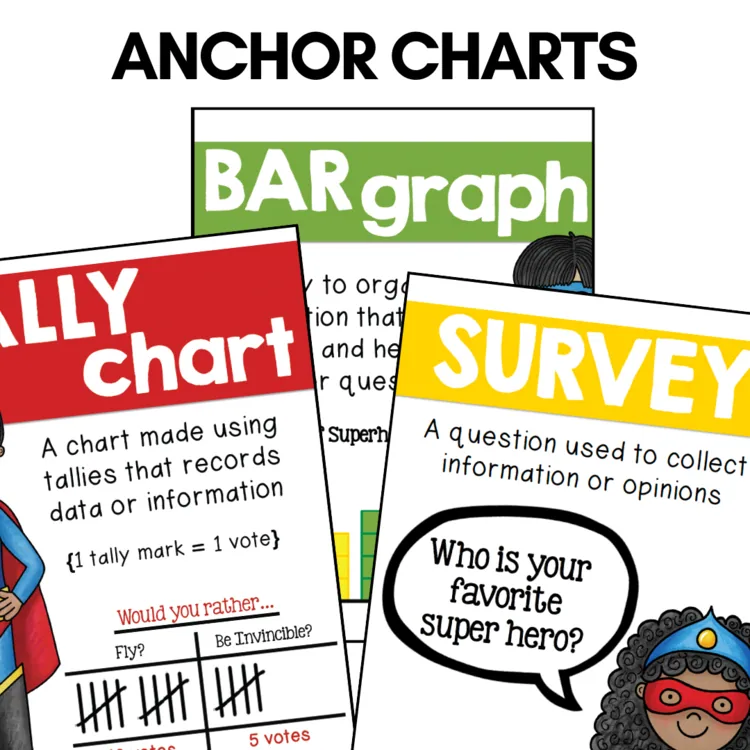
Help young learners engage in hands-on data collection and graphing with this versatile resource. Featuring anchor charts (bar graph, pictograph, tally chart, survey) and 16 blank survey templates, students will practice collecting, organizing, and interpreting data through tally charts, bar graphs, and pictographs.
Help young learners engage in hands-on data collection and graphing with this versatile resource. Featuring anchor charts (bar graph, pictograph, tally chart, survey) and 16 blank survey templates, students will practice collecting, organizing, and interpreting data through tally charts, bar graphs, and pictographs. This resource is perfect for fostering social interaction during math lessons and can be used all year long in whole-group activities, centers, or individual tasks.
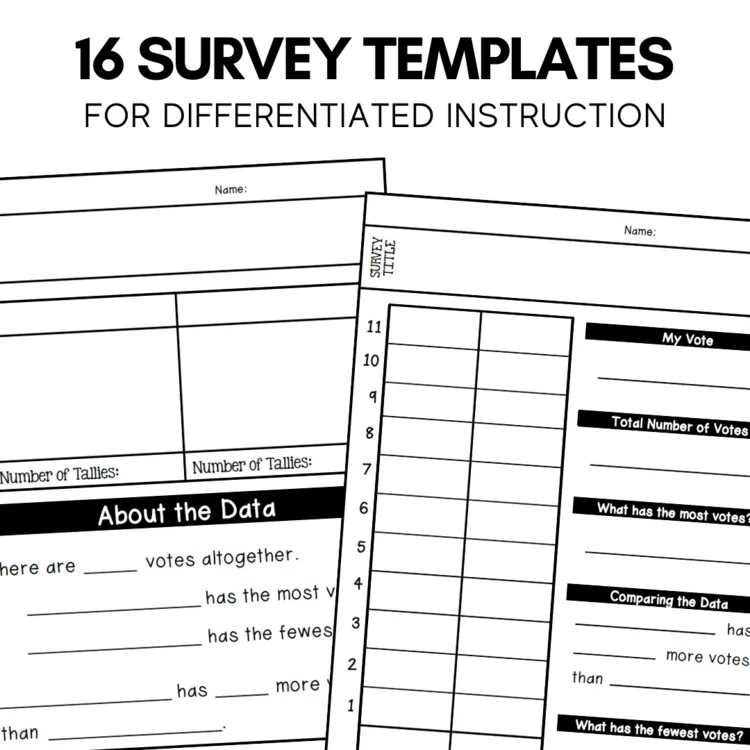
16 Make-your-own Surveys that include opportunities for students to collect, organize, represent, and interpret data with up to FOUR
Tally Charts
Bar Graphs
Pictographs
Showing What You Know Exit Graphing Exit Slip
These surveys are not specific to any theme, season, or question and may be used all year long. The surveys are great for individual use, whole-group lessons, or centers.
✅Download the preview to get a closer look at these templates and examples from my classroom!
268 reviews for Graphing Activities and Data Collection: Anchor Charts and Surveys for 1st & 2nd
Rated 5 out of 5
Jillian R –
After reading your wonderful ideas on first grade data and graphing on your blog, I knew I had to have this! Thank you!
Rated 5 out of 5
Meghan D. –
Great resource!
Rated 5 out of 5
Elisabeth S. –
These were very useful for our data and graphing unit.
Rated 5 out of 5
Felicidade Newberry –
A great resource, thanks
Rated 5 out of 5
Daisy Mae Productions –
I love the anchor charts and exit slip! Thanks.
Rated 5 out of 5
Victoria J. –
These are great for young learners to understand graphs by making their own! Wonderful resource!
Rated 5 out of 5
Angela S. –
Great resource for my low students!
Rated 5 out of 5
Cheryl W. –
good stuff
Rated 5 out of 5
Alicia G. –
Great to use for review with students
Rated 5 out of 5
Ginette L. –
Creative, cute, fun and kid friendly. Perfect for my class. Thanks!
Right after you check out, your download links are on the order confirmation page, and your receipt email has the same links. Don’t see the email? Check your spam or promotions folder.
Each resource downloads as a .zip folder that holds all of its files.
iPhone or iPad: open the Files app, find the zip in Downloads, and tap it. It unzips into a folder you can open.
Mac: double-click the zip.
Windows: right-click the zip and choose Extract All.
My file won’t open or shows a file-path error.
This usually happens on Windows when the files are unzipped inside the Downloads folder, because the folder path gets too long. Move the zip to your Desktop, then right-click it and choose Extract All.
Still stuck? Reach out and I’ll help.
Do I need an account?
No, you can check out without signing up. An account is created for you automatically with the email you use at checkout, and you’ll get an email to set your password. If you already have an account, your order is added to it.
All major credit and debit cards, Apple Pay and Google Pay (through Stripe), plus PayPal and Venmo. Payments are processed securely, and your card details never touch this site.
What is your refund policy?
Because these are digital resources, they can’t be returned once they’re downloaded. Please look over the product description and preview before you buy.
If something is wrong with a file, or you bought the same resource twice by mistake, reach out and I’ll make it right.
Practical K-2 math and upper-elementary morphology ideas, straight to your inbox. No spam, unsubscribe any time.
They can make ten. Can they use it?
Help students turn “I know ten” into “I can use ten.”
Join me for a hands-on workshop exploring what to model, which questions to ask, and how to respond when students get stuck using ten to add and subtract.
Includes a printable Teacher Toolkit, ready-to-use Number Talks, and the workshop recording.
Jillian R –
After reading your wonderful ideas on first grade data and graphing on your blog, I knew I had to have this! Thank you!
Meghan D. –
Great resource!
Elisabeth S. –
These were very useful for our data and graphing unit.
Felicidade Newberry –
A great resource, thanks
Daisy Mae Productions –
I love the anchor charts and exit slip! Thanks.
Victoria J. –
These are great for young learners to understand graphs by making their own! Wonderful resource!
Angela S. –
Great resource for my low students!
Cheryl W. –
good stuff
Alicia G. –
Great to use for review with students
Ginette L. –
Creative, cute, fun and kid friendly. Perfect for my class. Thanks!
Laura G. –
Great resource!
Kristi Zoerhof –
Thank you!
John E. –
Great resource! Thanks!
Ashley Hodges –
Love
Lesli M. –
A great supplement to my data unit! Thanks!
Taylor Fairchild –
Love these surveys and so did my first graders. 🙂