Out of all the math content taught in 1st grade, data and graphing is some of the most hands-on and fun. While I love place value and making 10 to add (and they play SUCH a huge role in later grades), towards the end of the year it’s nice to mix in ‘lighter’ content. Today I’ve shared my go-to ideas and centers for mastering data collection and graphing!
Data is Real Life
One of the great things about data and graphs is that it is completely real-life. Students interact with data ALL the time, without even knowing it. This ‘real-life’ aspect makes it the perfect ‘hook’ for reaching learners. To launch our unit, we take out all of our Reading A-Z books (from our book bins and our at-home reading bags) and we search for charts. We end up making a classroom collection of data and graphs! It’s the perfect tangible way to say “Data matters. It’s real. You see it every day.”
Pulling Out the Post-Its
Mini-lessons at my teacher table during our graphing unit open-up with whole-group mini-lessons. Typically, we do a related number talk, but during these two weeks I add on a mini-lesson. Over the course of the week, we pulled-out our post-it notes to survey our friends. From our favorite ways to play, to favorite foods, to which pet our class should-have-but-will-never-get. Each day we opened by creating our graph from the ground up. We learned to include a title, labels, axis, numbering each bar, not leaving gaps, etc. Plus, since post-its move so easily, it’s no big deal to make mistakes and change our thinking!
Integrating Geometry
Graphing is an easy unit to incorporate other strands of the math standards. We use a huge bag of 2D shapes to play “Scoop and Graph”. Students worked in partners at my teacher table to take a scoop of shapes and create a pictograph of the results. This was a GREAT chance to talk about how appearances can be deceiving. While the row of hexagons looked HUGE there were actually more diamonds. A spot-on way to learn (without me having to explicitly say it) that when graphing the units being used must be the same size.
Bumping-Up the Challenge
Pulling out our foam dominoes (Amazon affiliate link) it’s the perfect time to review sums and practice our addition fluency. Creating an axis with sums from 0-12, students sort and ‘graph’ the dominoes based on their sums. It’s a great seg-way into bar graphs because our foam dominoes are all the same width. You can snag a free recording sheet and visual directions to make this a perfect center during guided math!
Making Data Social
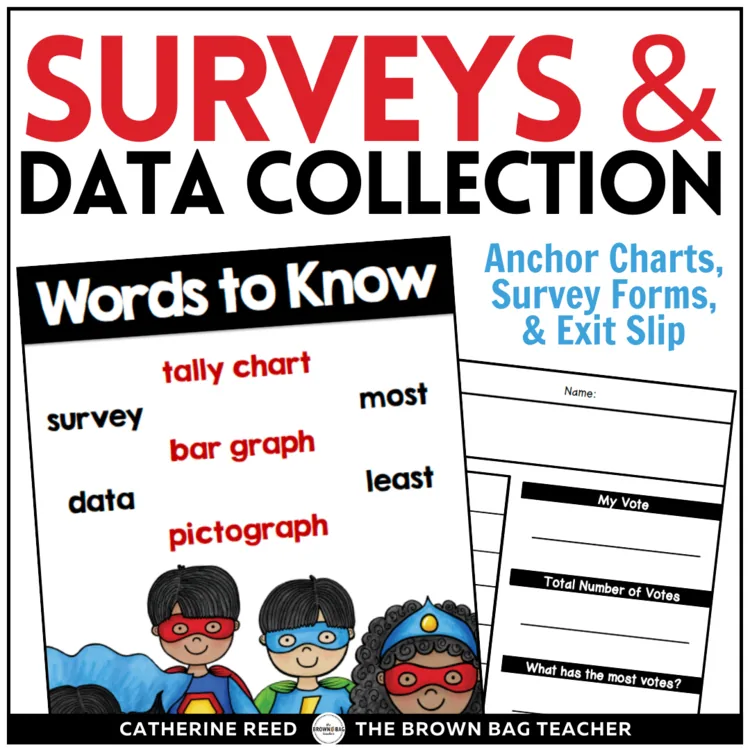
Collecting and organizing data is the perfect time to get your social learners up-and-moving. We LOVE working in pairs to create survey questions and learn more about our classmates. Initially we do surveys as a whole-group activity, later on it works perfectly as a center! Using a clipboard, survey recording sheet, and a partner, students create their own questions, collect responses, and analyze the results! (Snag a free survey recording log here. For a variety of options, click here.)
Analyzing Our Data
Collecting and representing data is an important part of the 1st Grade Common Core Standard; however, an equally important part of the standard is analyzing and discussing what students know and can learn from the data. It’s a great tie-in to earlier units because students are expected to apply math vocabulary in a real-world setting to demonstrate their knowledge. Vocabulary and concepts such as least, greater, compare, in all, etc. all become critically important. For my friends who often struggle with language and communicating their ideas, sentence frames and sentence stems have become our best friends in this unit. Some of our go-to sentence frames include:
_______ has the greatest number of _______.
_______ has _______ more _______ than _______.
_______ had the least number of _______ with _______.
_______ has _______ fewer _______ than _______.
There would need to be _______ for there to be a new winner.
Not every frame works every time but it gives our friends a place to start and some common vocabulary to use throughout the unit. When at our guided math table, we will ask questions and make observations about the data. To mix it up, we’ll also pull questions from our data jar and respond to them. When we introduce data into centers, friends create the graph and then are expected to pull and answer 2 questions in their math journals.
So friends, what are your go-to mini-lessons and ideas for data and graphing? It is such a fun unit and I would love to hear your ideas!




3 Responses
I love your blog and your creative thinking. Thank you for sharing!
Thank you for all your great hands on ideas. I feel like children better understand when they are doing hands on activities rather than worksheets.